
In-place vs loose density of loam and topsoil (FHWA)
Interactive chart of how much a cubic yard of loam or topsoil weighs in the ground (in place, or bank) and once dug and loaded (loose). Published by TakeoffMetric.
What the chart shows
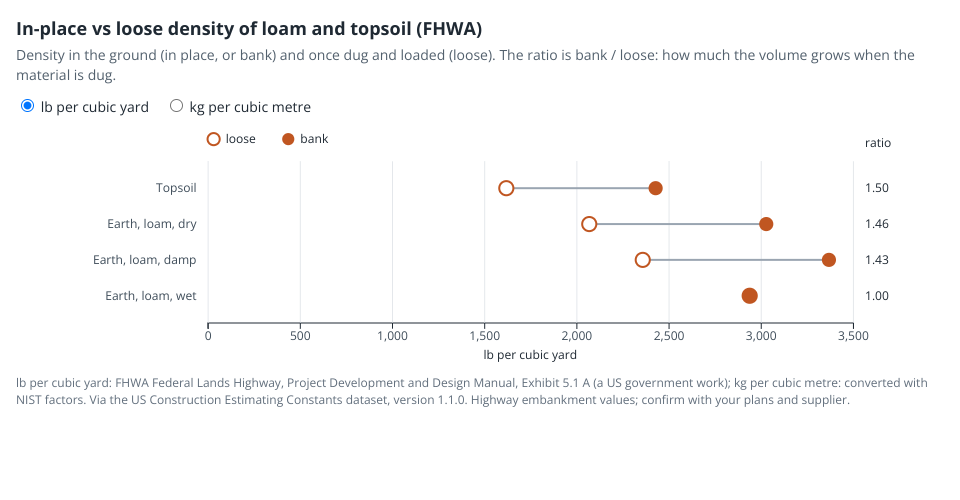
- The 4 materials for which FHWA's Exhibit 5.1 A gives both an in-place and a loose density: loam (dry, damp, wet) and topsoil
- One row per material: the loose density (open dot) and the in-place density (filled dot), in lb per cubic yard or kg per cubic metre (toggle)
- The bank-to-loose ratio at the right of each row; highest 1.50: topsoil; lowest 1.00: wet loam, for which FHWA prints the same density in place and loose
The same mass takes more room once it is dug. Example with dry loam: 10 cu yd measured in place weigh 30,300 lb (10 x 3,030); loose at 2,070 lb/cu yd, that mass fills 14.64 cu yd in the truck. Which density a supplier or a haul ticket uses changes the quantity to order.
Data
data.csv is generated from constants.csv of the dataset
US Construction Estimating Constants
(version 1.1.0, commit 1705750, rows EW-001, EW-002, EW-005, EW-006, EW-009, EW-010, EW-013, EW-014).
The lb per cubic yard values are FHWA's, read in the Federal Lands Highway
Project Development and Design Manual, Earthwork Design, Exhibit 5.1 A,
a US government work. FHWA gives them for estimating before project-specific
geotechnical data, for highway embankment work. The kg per cubic metre values
are the dataset's value_si column, converted from lb/yd3 with the exact NIST
factors and rounded to 4 significant digits. Columns: material, loose_id,
loose_condition, loose_lb_yd3, loose_kg_m3, bank_id, bank_lb_yd3,
bank_kg_m3, bank_to_loose (in place / loose, computed; FHWA prints the
same ratios rounded to 2 decimals: 1.46, 1.43, 1.00, 1.50).
The same dataset is on DataHub.
In the dataset, the used_by_tool_url column of these rows points to these
TakeoffMetric calculator pages:
- takeoffmetric.com/earthwork/fill-dirt-calculator/
- takeoffmetric.com/measure/cubic-yard-calculator/
- takeoffmetric.com/earthwork/topsoil-calculator/
How the calculators use them: methodology.
Earlier versions of this chart used a manufacturer's table whose values the dataset no longer republishes (version 1.1.0, publisher terms of use).
Densities change with moisture, gradation and compaction. Confirm with your plans and your supplier before ordering.
Built with D3 v7. Code: MIT.